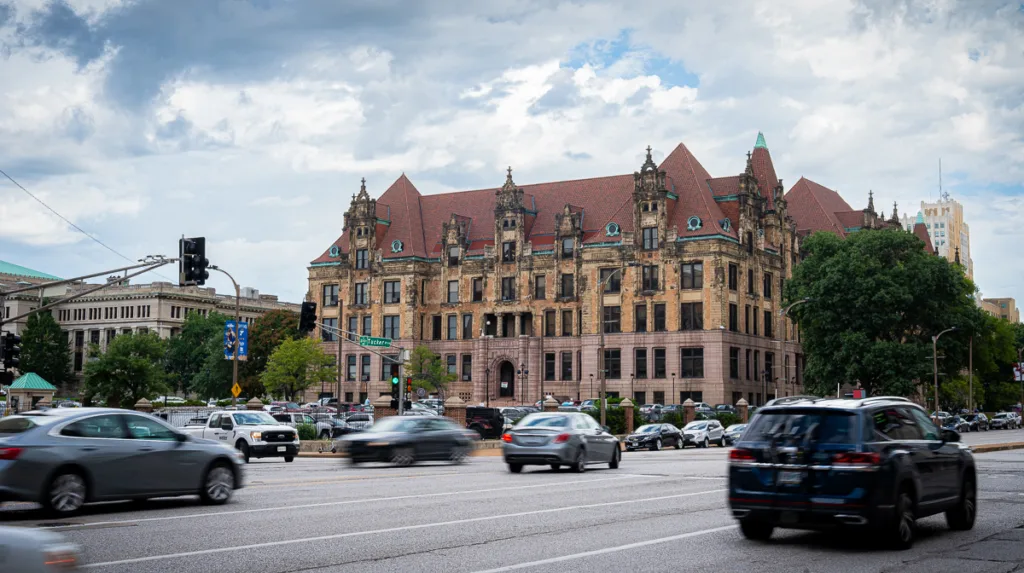
Yesterday, the U.S. Census Bureau announced the Missouri state results from the 2010 Census, including a sobering 8 percent decline for St. Louis city (read Ray Hartmann’s response here). Today, Mayor Francis Slay posted the full results for all neighborhood population changes in St. Louis city. Here’s the top 10 largest changes since the 2000 Census, both positive and negative (click here for a PDF of the full results):
1. Downtown
Get a fresh take on the day’s top news
Subscribe to the St. Louis Daily newsletter for a smart, succinct guide to local news from award-winning journalists Sarah Fenske and Ryan Krull.
Population 2000: 806
Population 2010: 3,701
Change: Up 359%
2. Forest Park (tie)
Population 2000: 4
Population 2010: 0
Change: Down 100%
2. Tower Grove Park (tie)
Population 2000: 4
Population 2010: 8
Change: Up 100%
3. Wilmore Park
Population 2000: 54
Population 2010: 7
Change: Down 87%
4. Downtown West
Population 2000: 2,204
Population 2010: 3,940
Change: Up 79%
5. Peabody Darst Webbe
Population 2000: 1,460
Population 2010: 2,378
Change: Up 63%
6. Missouri Botanical Garden
Population 2000: 5
Population 2010: 2
Change: Down 60%
7. McRee Town
Population 2000: 1,818
Population 2010: 1,037
Change: Down 43%
8. Penrose Park
Population 2000: 68
Population 2010: 40
Change: Down 41%
9. College Hill
Population 2000: 2,956
Population 2010: 1,871
Change: Down 37%
10. Cheltenham (tie)
Population 2000: 480
Population 2010: 620
Change: Up 29%
10. Covenant Blu-Grand Center (tie)
Population 2000: 2,758
Population 2010: 3,562
Change: Up 29%
10. Hyde Park (tie)
Population 2000: 3,741
Population 2010: 2,668
Change: Down 29%